Today we’ll cover how to find the intrinsic value of a stock.
In fact:
This is the same approach we used to develop our stock valuation algorithm.
First we'll define intrinsic value.
Next we'll review the models used most frequently by analysts to calculate intrinsic value.
Then we'll look at an intrinsic value example.
Let’s dive right in.
Introduction to Intrinsic Value
Intrinsic value is defined in many different ways.
We define intrinsic value based on Warren Buffett’s definition:
“Intrinsic value is an all important concept that offers the only logical approach to evaluating the relative attractiveness of investments and businesses. Intrinsic value can be defined simply: It is the discounted value of the cash that can be taken out of a business during its remaining life.
When the stock temporarily overperforms or underperforms the business, a limited number of shareholders – either sellers or buyers – receive outsized benefits at the expense of those they trade with.”
- Warren Buffett
Said differently, at any given time a stock has an intrinsic value, which is the actual value of a company’s discounted future cash flows.
Intrinsic Value = Present Value of a Company’s Lifetime Discounted Cash Flows
If a company's intrinsic value was obvious, you would either buy or sell the stock depending on whether the market price was higher or lower.
Unfortunately, a stock’s intrinsic value is never obvious.
This results in stock prices being driven by available information and each investors’ own interpretation.
How To Calculate Intrinsic Value
There isn’t one model or formula that investors agree is the best model for forecasting future cash flows.
But almost all of the leading investment banks use some version of a discounted cash flow (DCF) model to calculate the value of a stock.
There are two main DCF models that get the most attention from investors:
1. The Dividend Discount Model (DDM)
The Dividend Discount Model is the most simplified form of a DCF model.
This approach calculates a stock’s current intrinsic value based on the sum of expected future dividends, discounted back to present value.
The DDM works well when valuing companies with some history of paying dividends.
It also works better for companies that have future cash flows that are difficult to predict.
2. Free Cash Flow to the Firm (FCFF) Model
Free cash flows to the firm are company cash flows, after investing in working capital and fixed assets.
FCFF represents the remaining cash that can be distributed to debt and equity holders after a company reinvests earnings.
This model is the most commonly used valuation approach by financial analysts, because it values the total company, including debt, and not just equity.
The value of a company is determined in a FCFF model by discounting future cash flows, adding non-operating assets, and subtracting outstanding debt.
In this way, it incorporates the complete enterprise value of a company.
Other Valuation Models
It’s important to note that intrinsic value is not an absolute number.
It should be viewed as an expected value within a range of other alternative values.
There are several other valuation models that calculate a company's intrinsic value, and each one may return a different value:
- Economic Value Added (EVA) Model
- Benjamin Graham Valuation Formula
- Reverse DCF Model
These models are generally used less frequently than the DDM or FCFF model.
Recapping The Intrinsic Value Models
Each of these valuation methods have strengths and weaknesses.
But the most widely used approach is the free cash flow to firm model.
Let’s dive deeper into this model in our case study over the intrinsic value of Walmart (NYSE:WMT).
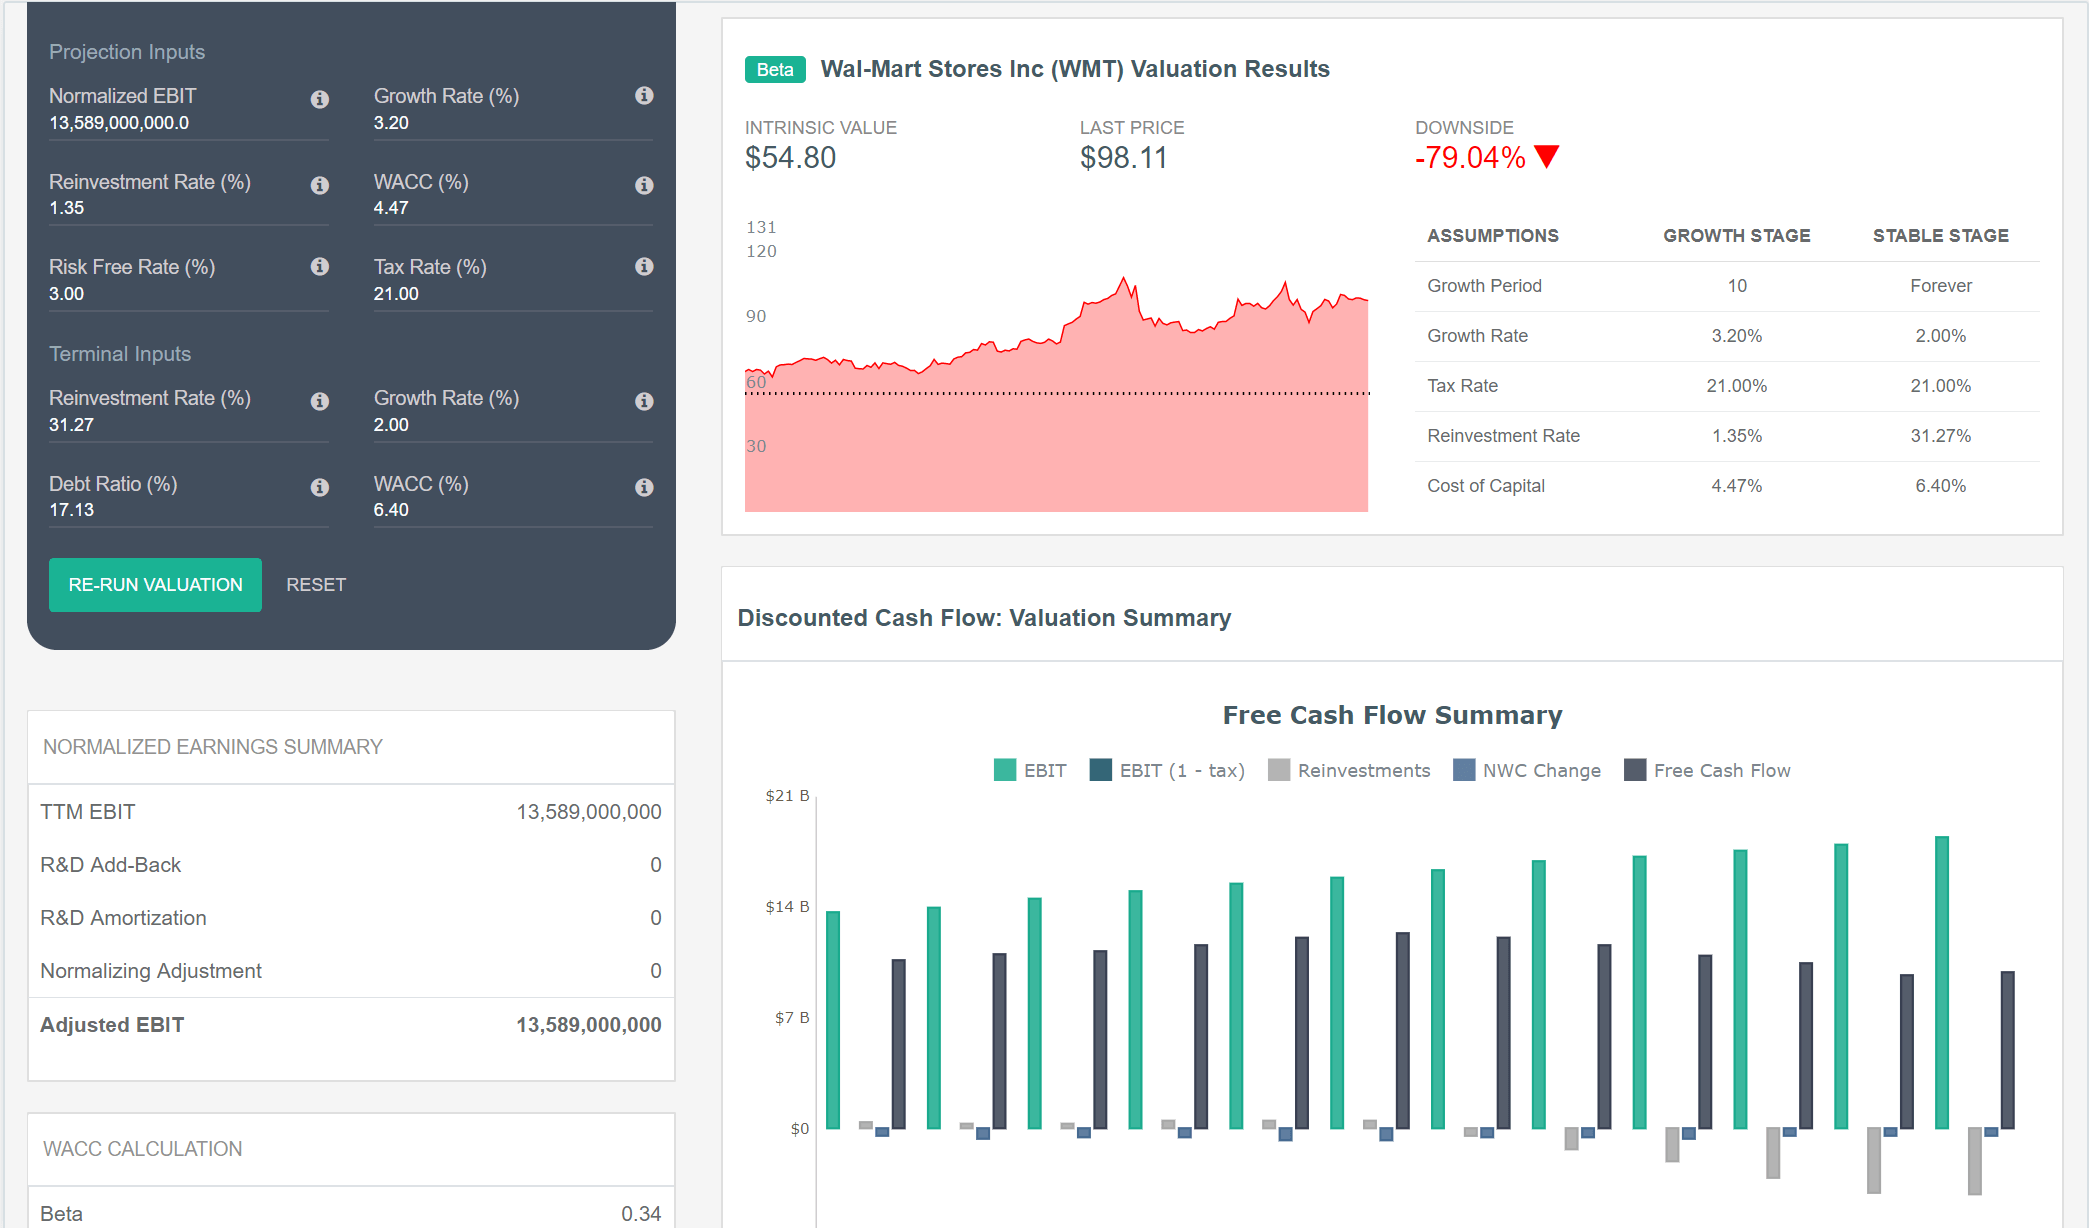
Intrinsic Value Example: Calculation of Walmart (WMT) Intrinsic Value
Free cash flow to the firm models can be completed in four steps:
- Estimate the company’s free cash flow during the growth period.
- Discount the estimated free cash flows by the weighted average cost of capital (WACC).
- Calculate the terminal value.
- Determine the enterprise value and the value of equity.
Let’s complete each of these steps to find the intrinsic value of Walmart.
Step #1: Estimate the Company’s Future Free Cash Flow
The first step in the intrinsic value calculation is to find the Company’s current free cash flow.
Current Free Cash Flow
You should use the most recently available information in your model, which is the trailing twelve month (TTM) period results.
Free cash flow is calculated in a number of different ways.
In our model, we use the formula:
FCFF = EBIT (1 - tax rate) - (Capital Expenditures - Depreciation) - (Change in Cash-Free, Debt-Free Net Working Capital)
For example, in our valuation model for Walmart, we calculate the TTM free cash flow based on the following:
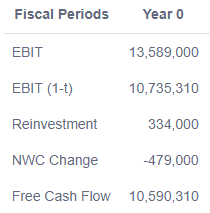
The current period free cash flow is used as the base year in the FCFF model.
Projected Growth Rate
The growth rate used in the model has a big impact on the overall valuation.
Four key factors should be considered when determining the growth rate:
- Is the Company impacted by economies of scale?
- Does the growth rate reflect the different business cycles of the Company?
- Is competition likely to enter the market and impact the Company’s future growth rate?
- Can the Company sustain their return on investment, and is the growth rate supported by the total value of the industry and the Company’s current market share?
In reality the projected growth rate will be an estimate. There is no way to know future growth with 100% certainty.
A few common methods for estimating a growth rate are:
- Use analyst estimates
- Use actual historical growth rates of a company
- Use a combination of both
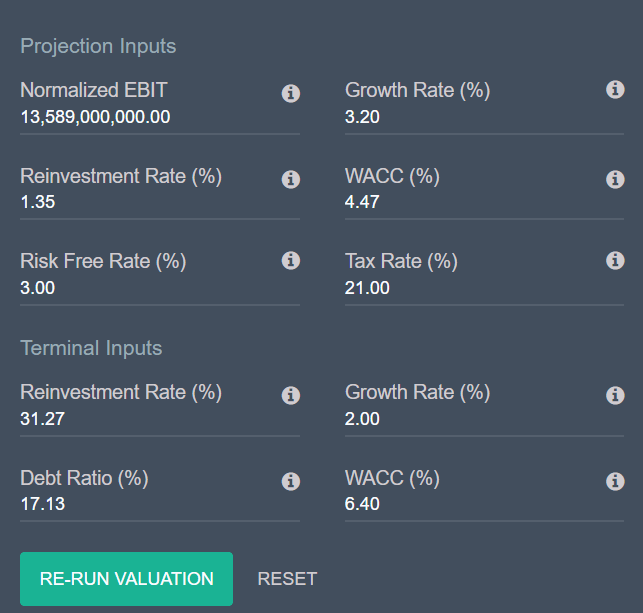
In our model, we use a combination of analyst estimates and historical growth rates of EBIT, EPS, and return on capital.
Using this approach, we calculated Walmart’s expected growth rate at 3.20%.
Projected Growth Period
In our DCF analysis of Walmart, we use a two-stage growth model.
Which means our model includes a high growth period of 3.20% year-over-year for the first five years.
The growth rate for the last five years of the model is reduced each year until it reaches the expected terminal growth rate of 2%.
The larger a company gets, the harder it is to maintain high growth rates.
The two-stage growth model takes this into account, which results in a more accurate projection of future cash flows.
Future Projected Free Cash Flows
Our model projects Walmart’s free cash flow over the next 10 years at:
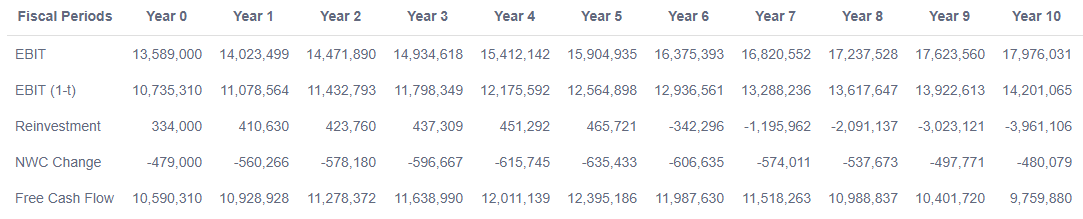
Step #2: Discount the Estimated Free Cash Flows by the Weighted Average Cost of Capital (WACC)
The next step in the FCFF model is to discount the projected free cash flows to net present value (NPV).
The discount rate that should be used in a FCFF model is the WACC.
The WACC model uses different inputs to calculate a company’s cost of capital including both debt and equity.
You can read more about the WACC and use our WACC calculator here.
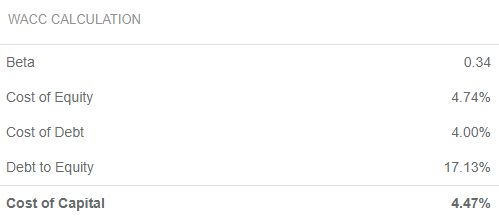
For Walmart, our algorithm calculated a WACC of 4.47%:
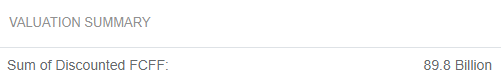
Using the WACC as the discount rate, the present value of Walmart’s future cash flows during the two-stage growth period is $89.8 Billion:
Step #3: Calculate the Terminal Value
The intrinsic value of a company is theoretically the present value of future cash flows from now until forever…
But since it is impossible to project cash flows over an infinite period, a terminal value is calculated.
The terminal value represents the ongoing value of a company after the original growth period.
In our model, this occurs after 10 years.
This value is purely theoretical, but it is the best method available to calculate the total value of a company’s future cash flows.
The terminal value starts with the free cash flow from the last year in your growth stage valuation, and a constant growth rate is applied.
Analysts often use the risk free rate as the constant growth rate in the terminal value calculation.
We use a rate of 2% in our model to be conservative, and a normalized WACC as the discount rate to calculate the terminal value.
Step #4: Determine the Enterprise Value and the Value of Equity
With the future cash flow projection completed, the next step is simple math to arrive at Walmart’s intrinsic value:
First, the terminal value is added to the present value of the discounted cash flows:
$212.8 Billion = $90.8B + $212B
This is the value of the Company’s operating assets.
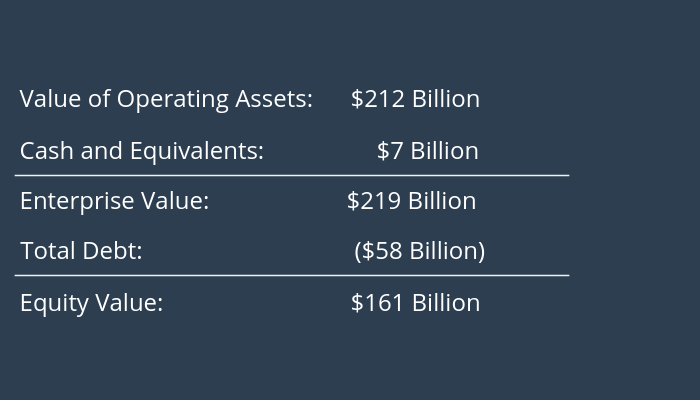
Second, the value of cash and other non-operating assets are added to arrive at an enterprise value.
Enterprise Value = Value of Operating Assets + Cash and Non-Operating Assets
The enterprise value is then reduced by total debt to determine the equity value of the Company.
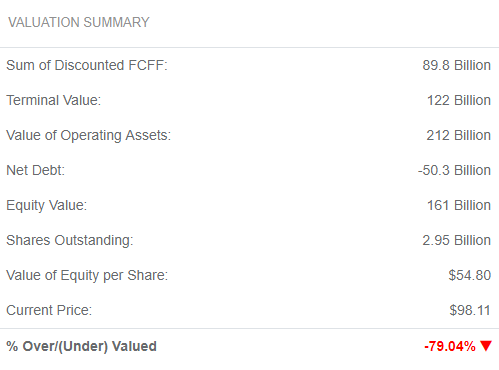
In our model, we combine the enterprise value and equity value calculation using net debt, which results in the same outcome:
The last step is to calculate the intrinsic value per share:
Intrinsic Value Per Share = $161B / 2.95B Shares Outstanding = $54.58 Per Share
Final Analysis and Fact Checking
Our calculated intrinsic value indicates that Walmart is currently overvalued.
But it’s important to continue your analysis beyond the intrinsic value.
There could be other factors impacting the Company’s market valuation.
- Is the growth rate used in the model reflecting all available information?
- Are there significant market or economic trends impacting the valuation that are not included in the model?
- Are the reinvestment rates used in the valuation model reasonable?
Remember that Intrinsic value changes over time.
Continue updating your valuation model frequently to understand how fundamental and overall market changes impact a stock’s intrinsic value.
Conclusion
Now that you know how to find the intrinsic value of a stock, you can better understand a company before investing.
For more tips on how you can take your stock analysis to the next level, check out our post covering fundamental analysis 101.
Or
Use our intrinsic value calculator to calculate a stock's value using the Ben Graham formula, and download our free stock valuation excel template.
And if you’re looking for awesome, undervalued stocks to buy right now, we break down 4 simple screens to find undervalued stocks here.