Before you start analyzing a stock, it’s important to understand the basics.
This guide covers the core concepts of fundamental analysis, and how to use them to make better investment decisions.
The best part?
These are the same techniques that the best value investors are using right now to make money in the stock market.
In short: if you want to effectively analyze a stock, you’ll love this guide.
Let’s get started.
What is fundamental analysis?

Fundamental analysis is the practice of evaluating a company’s financial results to make a more informed investment decision.
In practice, this can mean a lot of things:
- Analyzing a company’s balance sheet, income statement and cash flow statement
- Using financial data to calculate an independent value of a Company
- Reviewing economic data and industry trends
Fundamental analysis is usually a long term investing strategy.
Why is this the case?
Because the core belief of fundamental investors is that market prices do not accurately reflect all available information on a company. This means, at any given time, a stock is either overvalued, undervalued or priced right at its intrinsic value.
For example, let’s say Warren Buffett completes his fundamental analysis of Microsoft, and believes that the stock is undervalued.
This means other investors haven’t correctly valued the stock. Buffett would buy the stock and then wait for more investors to realize that the stock is undervalued.
Once other investors realize that Apple is undervalued, they will buy the stock too, and drive the price per share higher.
But here's the bad news:
It could be days, months or years before other investors find the stock.
Buffett may need to hold the stock for a long time before making a profit.
Why is fundamental analysis important?
The alternative to fundamental analysis is an investment strategy based on price and/or momentum. The most well-known alternative is technical analysis, which looks at trends or patterns in a company’s stock price to predict future price movements.
And while that may be helpful in predicting how the market will price a stock, it doesn’t tell you what the company’s stock price should be.
This is why fundamental analysis is so important.
Without analyzing a company’s fundamentals, you’re simply trading based on price and speculation.
How do you perform fundamental analysis?
Every company is different, which means your stock analysis may be different for each company as well.
But there are some guidelines to follow that generally always apply:
Basic principles:
- Fundamental analysis is based on measurable outputs. You are using the facts and information that is available to make an informed investment decision. This means avoiding speculation and “gut-feelings” that drive some investors to buy stocks they don’t truly understand.
- The goal is to completely understand a company, it’s industry, key risk factors, and it’s potential for growth. There is no clear road map to follow that applies to every company. The best fundamental investors find and analyze the unique information that matters most to a company’s performance.
- At the end of the day, earnings drive value. Fundamental investors want to invest in companies that make a lot of money. When a company is making money they can reinvest and drive growth, or distribute the excess cash to shareholders (i.e., dividends). Either way, it’s a win/win.
These basic principles of fundamental analysis are important for value investors to understand. But the things you should avoid can be almost as important to your analysis.
Things to avoid:
- Companies with limited historical information. Analyzing a company is very difficult without the right data. Warren Buffett famously avoids investing in start-ups and IPO’s for this very reason. How can you fully understand a company, if you don’t have access to the right information?
- Don’t let bias drive you to a conclusion. Like anything, our own biases can impact the way we interpret information. If you go into analyzing a stock thinking that the stock is undervalued, you will undoubtedly find information to support that conclusion. It’s important to remain unbiased and take a fact-based approach to analyzing a company.
- Stale or out-of-date information can hurt your analysis. It’s important to use the most recent information to evaluate a stock.
- Stay away from luke-warm investments. If you aren’t sure about a company, it’s best to error on the side of caution. One key trait of all great fundamental investors is that they avoid stock market losses. If you find both positives and negatives in your analysis, it’s best to move on to the next company, and avoid buying a stock you don’t fully understand.
- Lastly, fundamental analysis is not a one-time event. With new data releases, updated financial statements, and changes in stock prices, your fundamental analysis will change too. You may conclude that a stock is overvalued one year, but then new information becomes available that changes your conclusion. That is OK. A company’s intrinsic value doesn’t stay the same. Outside factors and new information can change a company’s value.
Fundamental analysis example
The more you analyze stocks the faster and better you become at it.
If you want to make money in the stock market by using fundamental analysis, developing a consistent approach is important.
Before building DiscoverCI, we used customized excel workbooks and data templates. This was a very labor-intensive process!
So, we developed DiscoverCI to make it easier to analyze every stock.
For example, if we were evaluating Microsoft (NASDAQ:MSFT), the first thing we would do is a run a discounted cash flow model (“DCF”) to calculate the intrinsic value of the Company.
There are many elements to a DCF analysis, but it boils down to projecting the future cash flows of the Company, and discounting them back to present value.
Using this method, you are able to calculate the stock's intrinsic value and then compare it to the current stock price.
Our model is showing that Microsoft is currently overvalued:
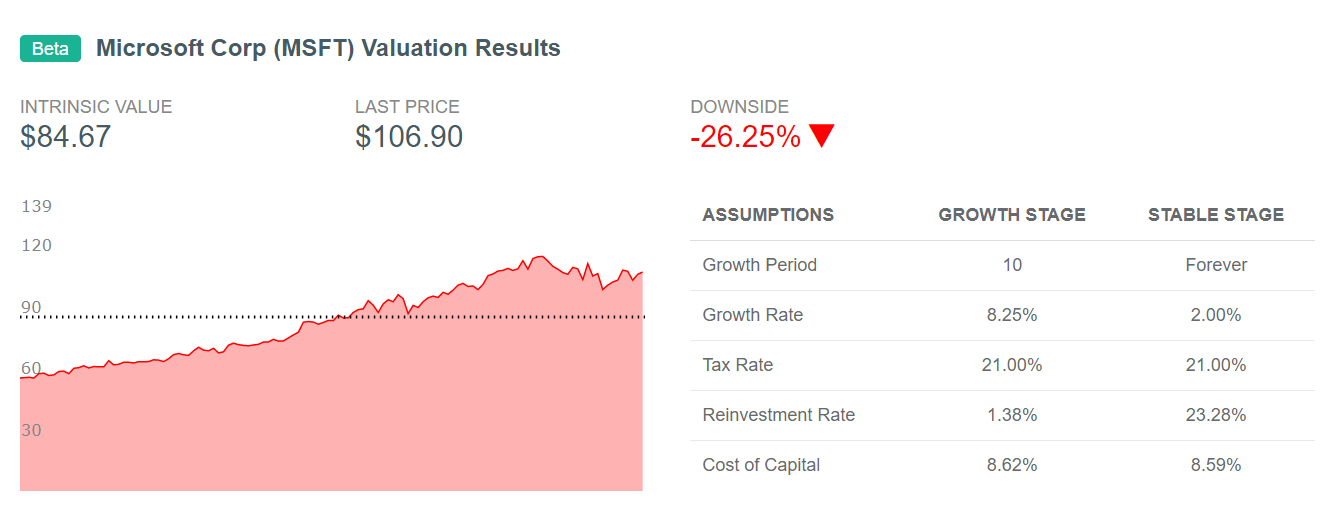
On the surface, this means the Company’s future cash flows don’t support the current market price of the stock.
But your analysis shouldn’t stop here, value investors spend time analyzing each of the key inputs into the model to make sure they are reasonable.
For example, our model used a growth rate of 8.25%, which is based on a mix of historical results, and analyst projected growth.
But what if you had a different outlook?
Using the valuation input form, we changed the growth rate in our model to 15% (which, you can do here as well), and re-ran the valuation.
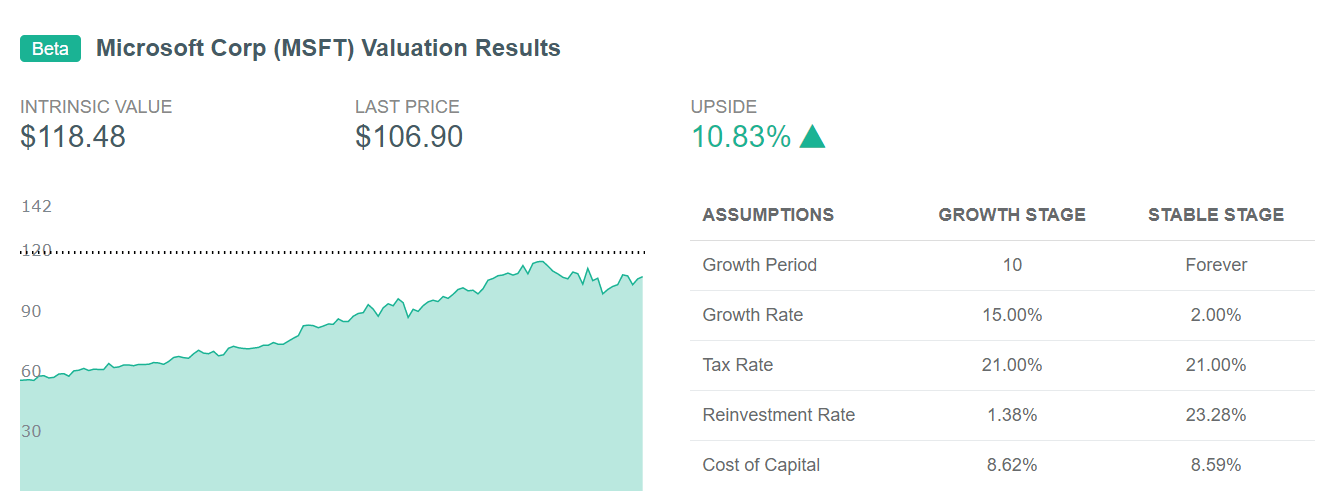
As you can see, this change increased the intrinsic value of the Company to a position that would imply they are undervalued by the market.
Stock valuation can be subjective and sensitive to the inputs used in the model, but it is a necessary element to fully analyze a company.
Let’s say that based on your valuation, you felt Microsoft could be undervalued.
The next step is to analyze the relevant factors and determine whether Microsoft looks like an awesome company with high future growth potential, or if there are indicators that a downturn could be coming.
This means using a checklist to perform an initial screen of the stock.
Each of the stocks we cover includes a score calculated based on the following ratios:
- Piotroski F Score
- Altman Z Score
- Price to Book Value (P/BV)
- Current Ratio
- Price to Earnings (P/E)
- Earnings Yield
- Revenue Growth
- EBITDA Growth
- Debt to Equity
Based on these ratios, Microsoft is currently scoring a 3/9 on our checklist:
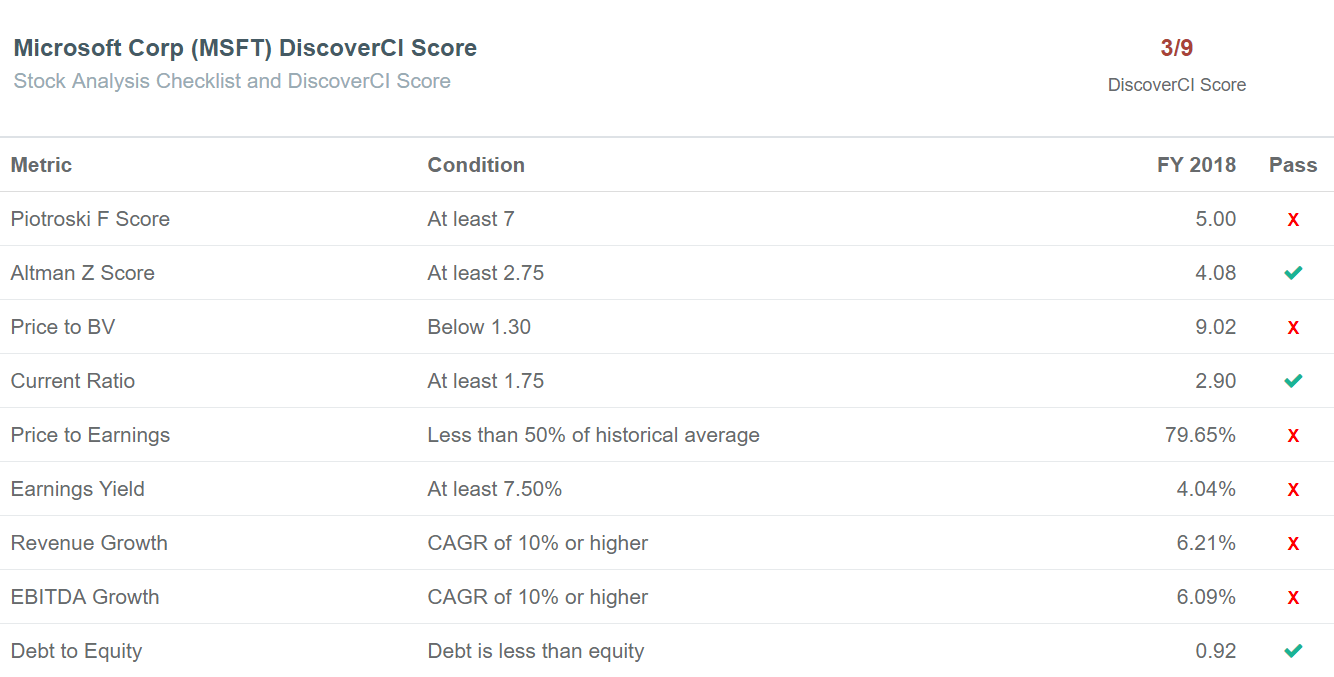
These ratios are a mix of metrics that measure a company’s liquidity, potential for growth, market valuation, and overall health of the Company.
These may not be the only critical metrics for a company, but they are a good place to start.
We also use a checklist to compare the Company’s current growth ratios to historical and sector averages:
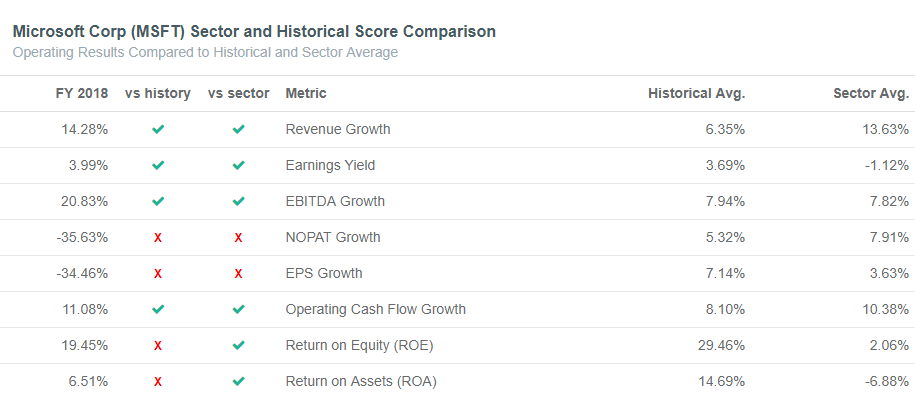
Knowing how a company compares to it’s past, and industry averages, can be a great way to analyze where the company is heading.
If you're interested in knowing how a company's current valuation compares to industry averages, you can check out average EBITDA multiples by industry here.
Over To You
Now we’d like to hear from you:
What do you think of fundamental analysis so far?
Or
What is working well for you so far?
Either way, let us know, and if you’re interested in checking out more of our stock analysis tools, here are a few places to start:
- Head over to our stock analysis page and search for a stock to start your analysis
- Use our financial calculators to quickly calculate financial metrics
- Download our free stock valuation excel template
- Looking for undervalued stocks? Use our customizable stock screener to filter and screen for awesome companies
- Learn how to calculate the intrinsic value of a stock
- Ready for another blog post? Check out our deep dive into financial ratio analysis