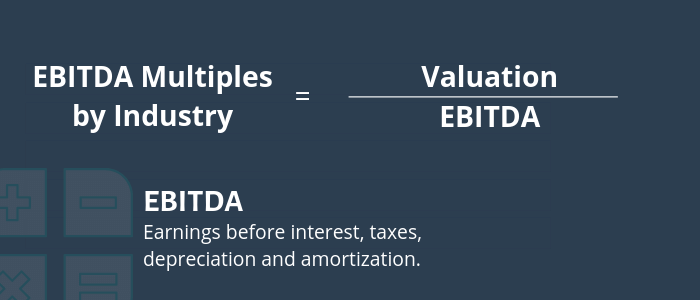
Industry EBITDA Multiples in 2020
Earnings Before Interest, Taxes, Depreciation and Amortization (EBITDA), is a key measure of company profitability.
Investors use EBITDA to better understand the cash flow of a company, by adding back non-cash expenses to net income.
EBITDA is also a great tool for understanding how the market is currently valuing a stock.
Specifically, it is an important ratio for understanding how a company is valued compared to its industry peers.
This guide includes EBITDA valuation multiples for each industry, so you can benchmark and analyze companies against their peers.
Let’s get started.
EBITDA Multiple Valuation by Industry
In the table below, you can find the median EBITDA multiple valuation by industry.
The table is updated weekly, and presents EBITDA, Marketcap, EBITDA valuation multiple, Enterprise Value (EV)/EBITDA, and EV/EBIT:
As you can see, the valuation ratios of each industry sector presented in the table are not all the same.
There are different growth expectations for each industry, and smart investors factor industry growth into their fundamental analysis.
You can interact and download the data in the table above by right-clicking on the table.
Total Marketcap by Industry
To understand the size of each industry, the tree map below presents the total Marketcap by sector.
All publicly traded United States stocks are included in the dataset:
Using EBITDA Valuation Multiples in Your Stock Analysis
Industry metrics are important for understanding macro level trends.
Knowing how a stock’s value is impacted by macro economic factors is a key element of fundamental analysis.
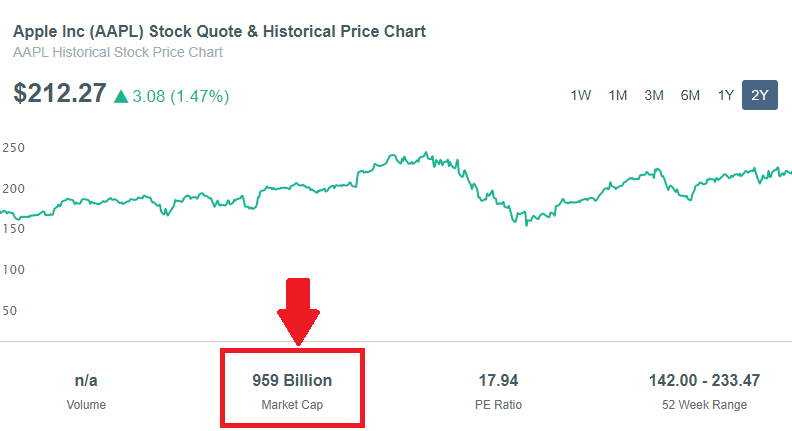
First, you need to find the Marketcap and EBITDA of the company you are analyzing.
For example, you can find Apple’s (AAPL) Marketcap here:
And their trailing twelve month (TTM) EBITDA of $78.2 B, which you can find here:
-ebitda-chart-193082ca86b96c365c39a232f66044bf48be98b1b50ef7019a96a71e603c63bf.png)
Using the information above, the next step is calculating Apple’s EBITDA valuation multiple:
EBITDA Multiple:
12.26 = $959B / $78.2B
Apple’s EBITDA multiple of 12.26 means investors are willing to pay a premium to buy shares of the company. Over 12 times EBITDA per share to be exact!
This is higher than other companies within the Consumer Durables industry, meaning investors expect Apple to grow faster than its peers.
What’s Next?
Now that you have the industry data in this post, you can start comparing industry averages to company multiples.
Check out our company profiles and search for any U.S. publicly traded company:
Analyze Any Stock FREE!
Hours of stock analysis in 10 seconds or less!
Or
Use one of our other stock analysis or stock research tools:
- Head over to our stock valuation page and try out our automated stock valuation tool
- Use our other financial calculators to quickly calculate other financial ratios and metrics
- Looking for undervalued stocks? Use our fundamental stock screener to filter and screen for awesome companies
- Learn how to calculate the intrinsic value of a stock
- Download our free stock valuation excel template
- Ready for another blog post? Check out our article covering fundamental analysis
Grow Your Investing Knowledge
- Get investing tips, strategies, and news straight to your inbox.
- Stay up-to-date on key factors impacting today's stock market.
- Be the first to know about new posts and updates from the DiscoverCI Team.