It’s true, large cap stocks can provide more stable returns in the stock market. But what about traders seeking more risk and volatility?
Look no further than actively traded penny stocks.
While investing in these stocks is more of a gamble than betting on blue-chip stocks, the pay off can be significant.
If you’re an investor looking to add volatility to your portfolio as we move into 2019, here is a list of 11 NASDAQ penny stocks with high beta and trade volume.
The criteria used to identify these stocks was:
- Traded on the NASDAQ Exchange
- Stock price under $5
- Average daily trading volume over 3 million
- Beta over 1.5
*All price and stock information is accurate as of December 6th, 2018.
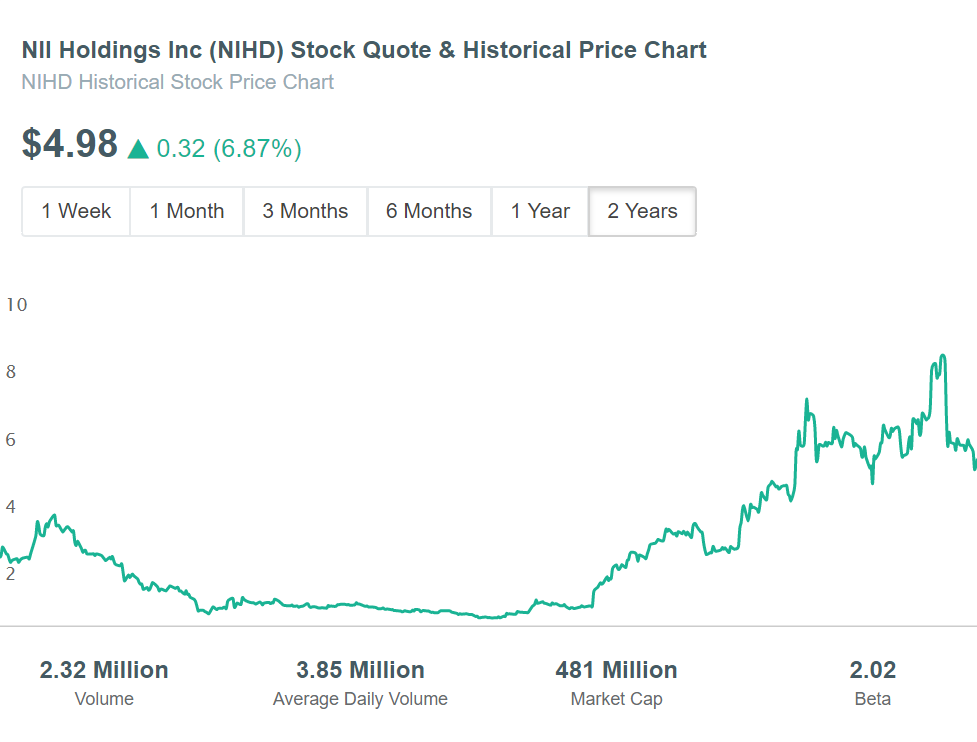
1. NII Holdings Inc (NIHD)
Average Daily Volume: 3,853,440
Market Capitalization: $481 Million
Beta: 2.02
52 Week High: $8.51
52 Week Low: $0.23
Adjusted Close Price: $4.98
NII Holdings Inc (NASDAQ:NIHD) engages in the development and provision of wireless communication services, and is headquartered in Virginia, United States. NIHD was founded in 1995, and it’s current CEO is Steven Shindler. NII Holdings competes in the Technology Sector.
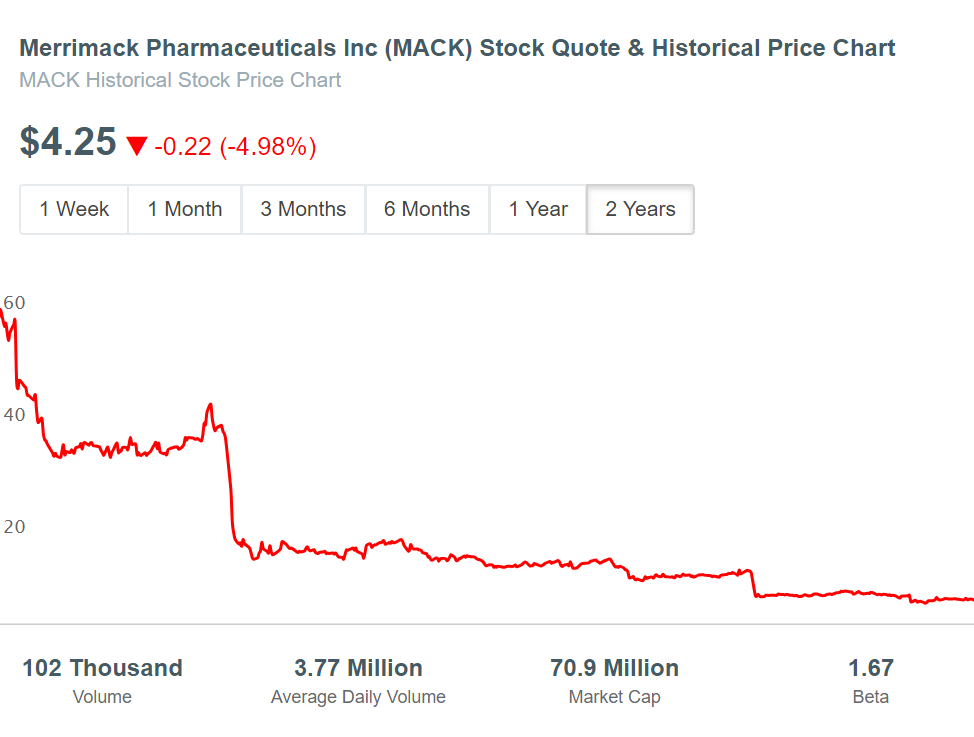
2. Merrimack Pharmaceuticals Inc (MACK)
Average Daily Volume: 3,766,298
Market Capitalization: $71 Million
Beta: 1.67
52 Week High: $11.70
52 Week Low: $3.34
Adjusted Close Price: $4.20
Merrimack Pharmaceuticals Inc (NASDAQ:MACK) engages in discovering, developing and preparing to commercialize innovative medicines, primarily for the treatment of cancer. Merrimack Pharmaceuticals is headquartered in Massachusetts, United States and was was founded in 1993. The Company competes in the Healthcare - Biotechnology Sector, and it’s current CEO is Richard Peters.
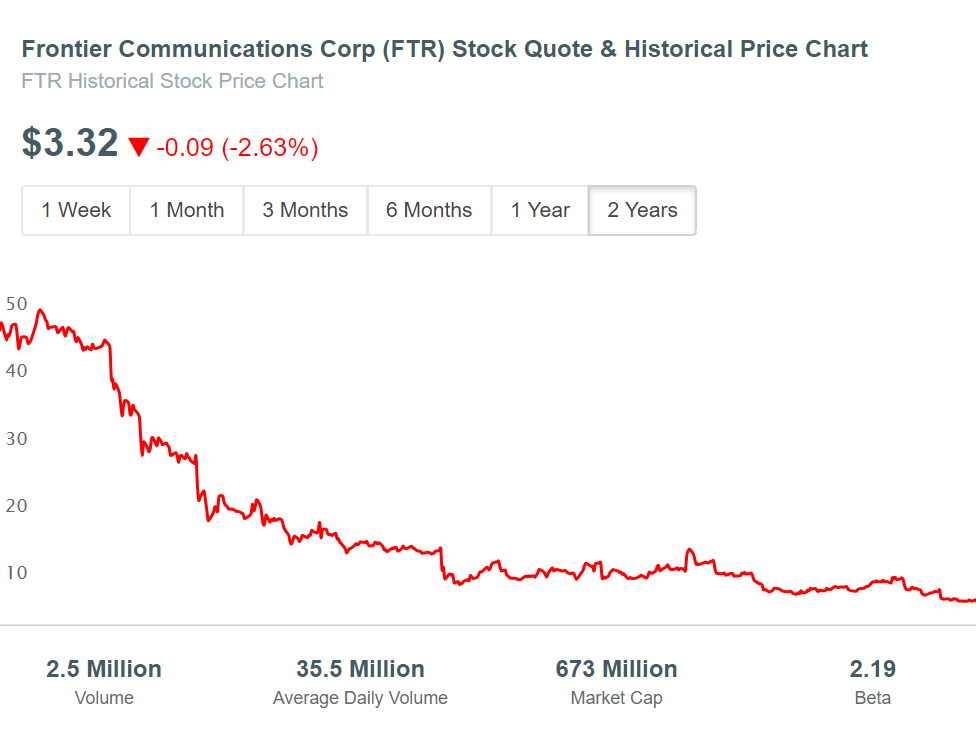
3. Frontier Communications Corp (FTR)
Average Daily Volume: 35,513,948
Market Capitalization: $673 Million
Beta: 2.19
52 Week High: $11.64
52 Week Low: $3.30
Adjusted Close Price: $3.33
Frontier Communications Corp (NASDAQ:FTR) engages in providing voice, data, and video services to urban, suburban, and rural customers. Frontier Communications is headquartered in Connecticut, United States and was was founded in 1935. The Company competes in the Technology - Telecom Services Sector, and it’s current CEO is Daniel McCarthy.
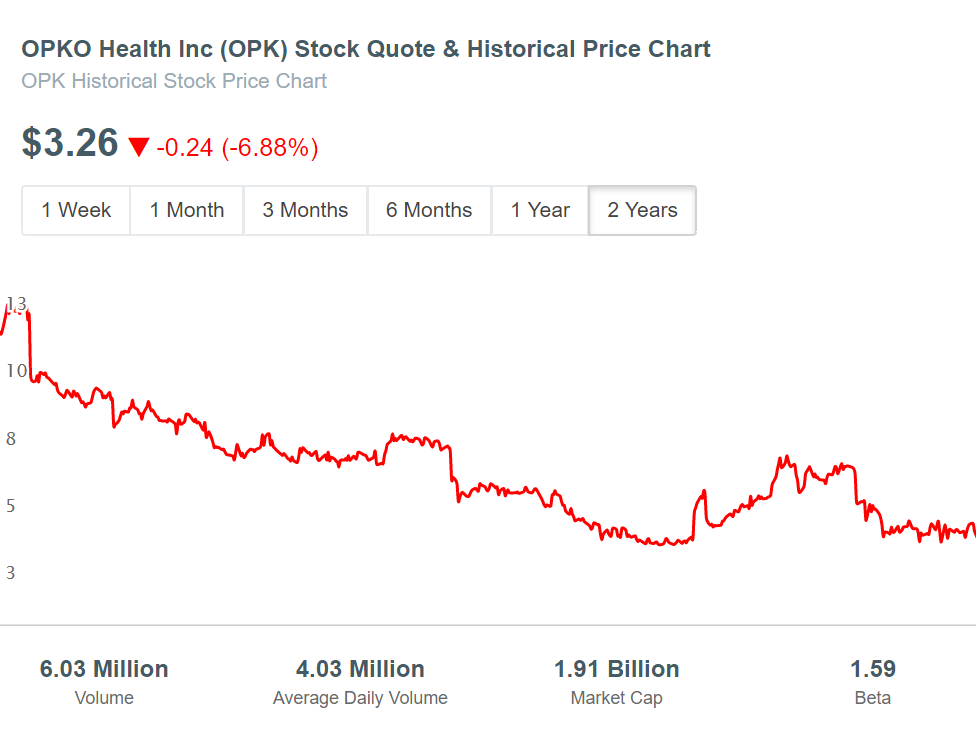
4. OPKO Health Inc (OPK)
Average Daily Volume: 4,029,795
Market Capitalization: $1.91 Billion
Beta: 1.59
52 Week High: $6.40
52 Week Low: $2.66
Adjusted Close Price: $3.25
OPKO Health Inc (NASDAQ:OPK) is a diversified healthcare company, operating through Diagnostics, and Pharmaceutical segments. OPKO Health is headquartered in Florida, United States and was was founded in 1991. The Company competes in the Healthcare - Biotechnology Sector, and it’s current CEO is Phillip Frost.
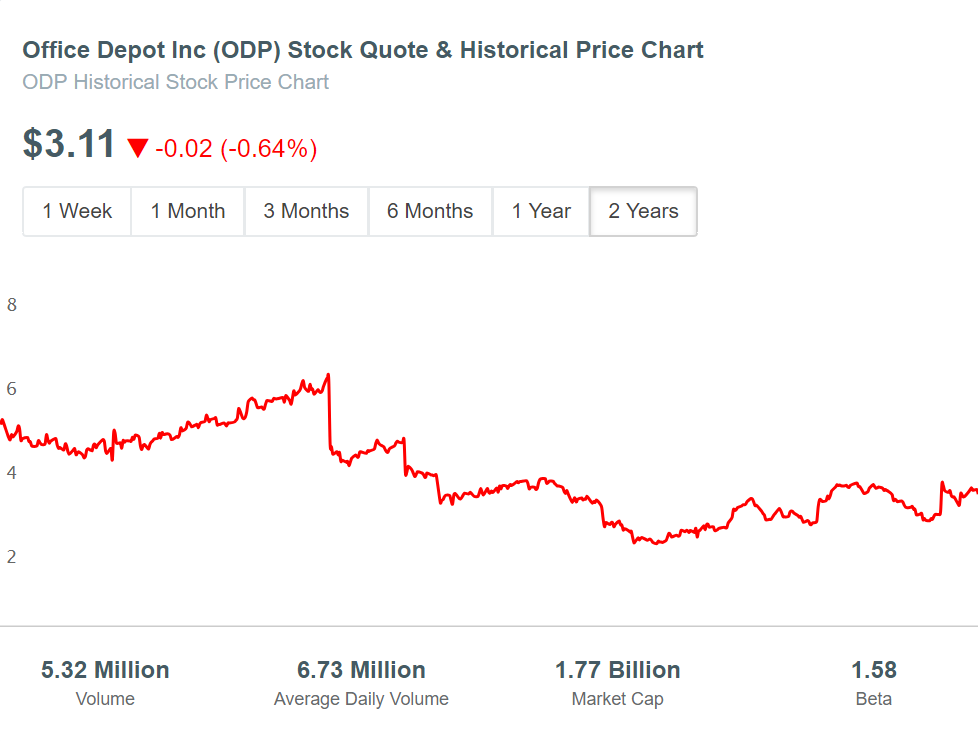
5. Office Depot Inc (ODP)
Average Daily Volume: 6,727,498
Market Capitalization: $1.77 Billion
Beta: 1.58
52 Week High: $3.66
52 Week Low: $2.00
Adjusted Close Price: $3.12
Office Depot Inc (NASDAQ:ODP) offers office products and services to a diversified customer base in North America. Office Depot is headquartered in Florida, United States and was founded in 1986. The Company competes in the Services and Specialty Retail Sectors, and it’s current CEO is Gerry Smith.
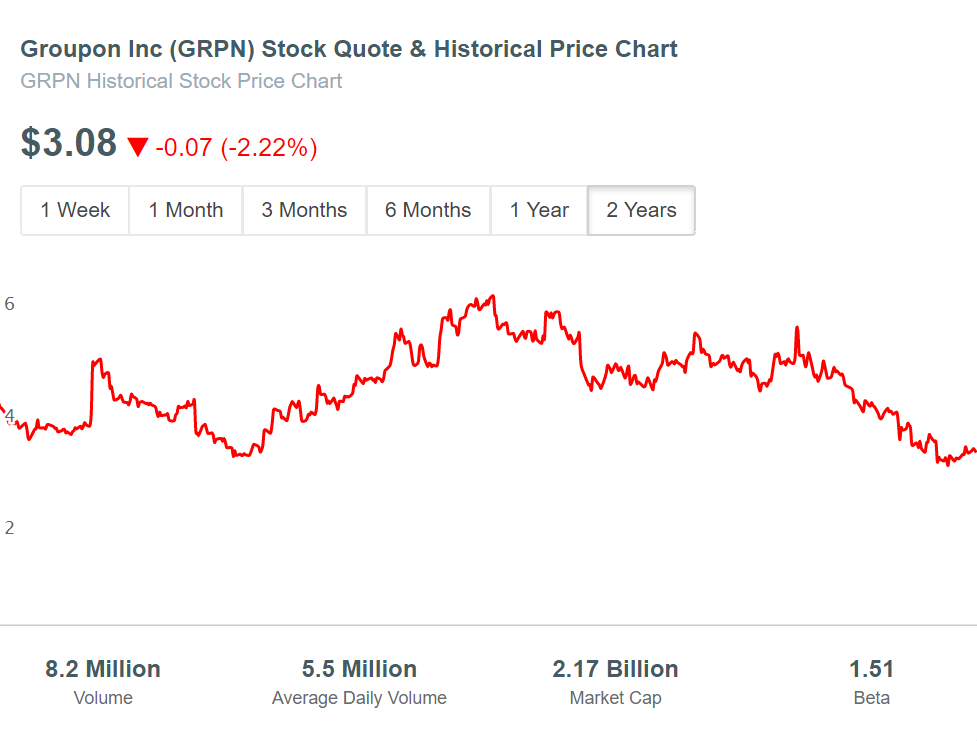
6. Groupon Inc (GRPN)
Average Daily Volume: 5,496,891
Market Capitalization: $2.17 Billion
Beta: 1.51
52 Week High: $5.88
52 Week Low: $2.80
Adjusted Close Price: $3.08
Groupon Inc (NASDAQ:GRPN) is a local commerce marketplace that connects local merchants to customers by offering flash discounts on goods and services. Groupon is headquartered in Illinois, United States and was was founded in 2008. The Company competes in the Technology Sector, and it’s current CEO is Richard Williams.
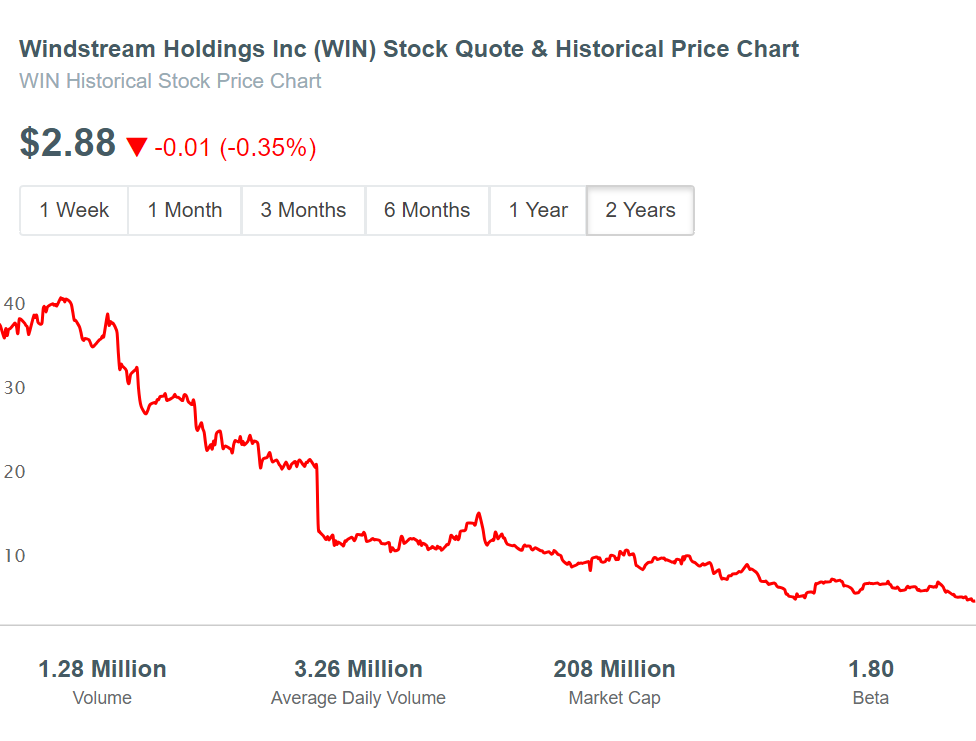
7. Windstream Holdings Inc (WIN)
Average Daily Volume: 3,261,745
Market Capitalization: $208 Million
Beta: 1.80
52 Week High: $11.20
52 Week Low: $2.61
Adjusted Close Price: $2.88
Windstream Holdings Inc (NASDAQ:WIN) provides communication and technology solutions through their Consumer and Small Business Enterprise solutions. Windstream is headquartered in Arkansas, United States and was was founded in 2013. The Company competes in the Technology - Telecom Sector, and it’s current CEO is Tony Thomas.
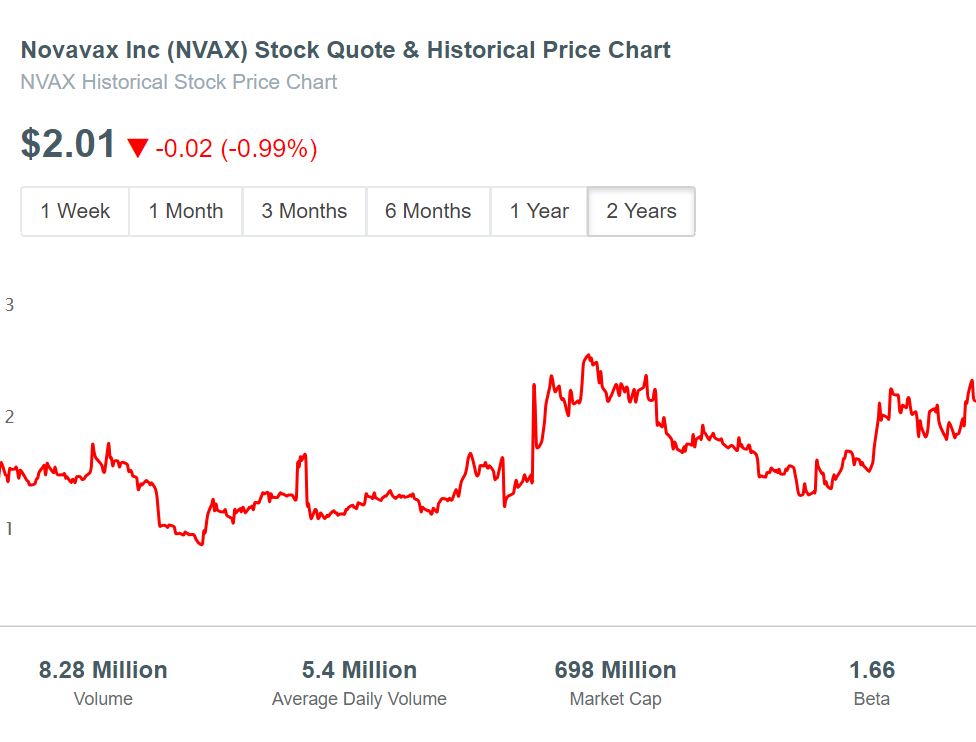
8. Novavax Inc (NVAX)
Average Daily Volume: 5,398,890
Market Capitalization: $698 Million
Beta: 1.66
52 Week High: $2.75
52 Week Low: $1.05
Adjusted Close Price: $2.01
Novavax Inc (NASDAQ:NVAX) is a clinical-stage biopharmaceutical company, which develops and nanoparticle vaccines and adjuvants, primarily to target infectious diseases. Novavax is headquartered in Maryland, United States and was was founded in 1987. The Company competes in the Healthcare - Biotechnology Sector, and it’s current CEO is Stanley Erck.
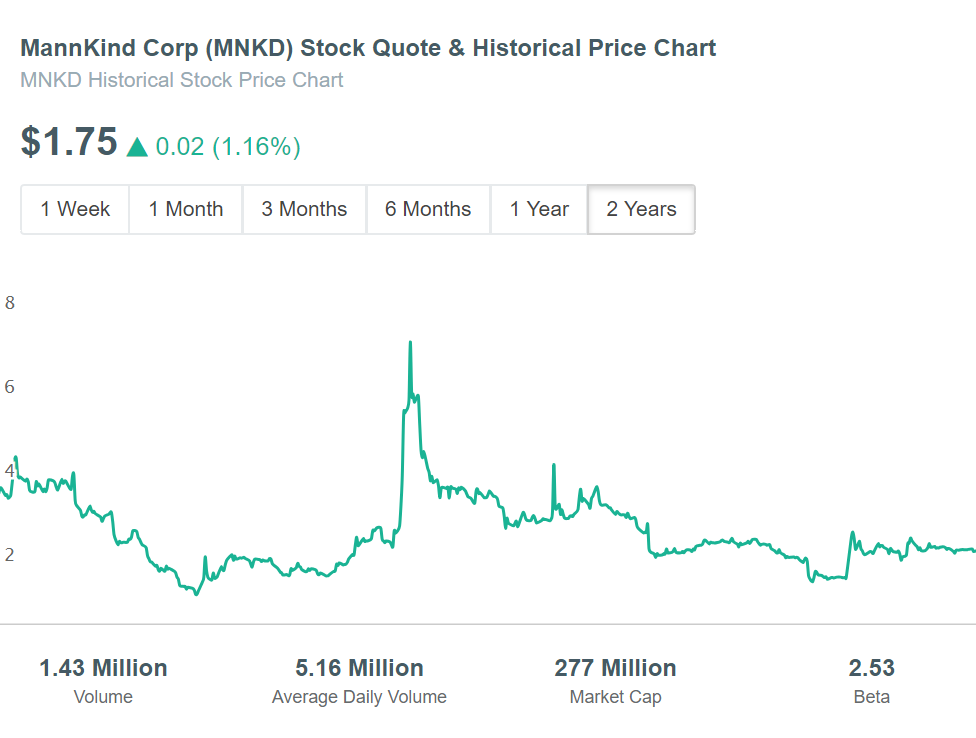
9. MannKind Corp (MNKD)
Average Daily Volume: 5,163,803
Market Capitalization: $277 Million
Beta: 2.53
52 Week High: $4.05
52 Week Low: $0.98
Adjusted Close Price: $1.75
MannKind Corp (NASDAQ:MNKD) is a biopharmaceutical company, focusing on the discovery, development and commercialization of therapeutic products for diseases, such as diabetes and cancer. MannKind is headquartered in California, United States and was was founded in 1991. The Company competes in the Healthcare - Biotechnology Sector, and it’s current CEO is Matthew Pfeffer.
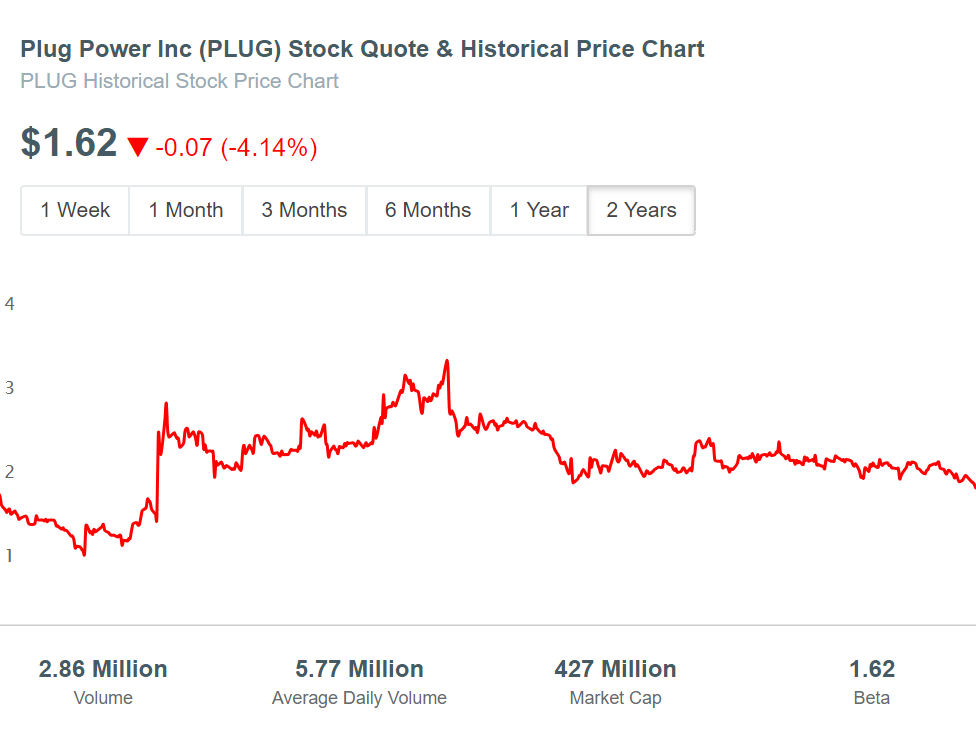
10. Plug Power Inc (PLUG)
Average Daily Volume: 5,767,521
Market Capitalization: $427 Million
Beta: 1.62
52 Week High: $2.48
52 Week Low: $1.53
Adjusted Close Price: $1.62
Plug Power Inc (NASDAQ:PLUG) provides alternative energy technology, which focuses on the design, development, commercialization and manufacture of fuel cell system. Plug Power is headquartered in New York, United States and was was founded in 1997. The Company competes in the Technology - Diversified Electronics Sector, and it’s current CEO is Andrew Marsh.
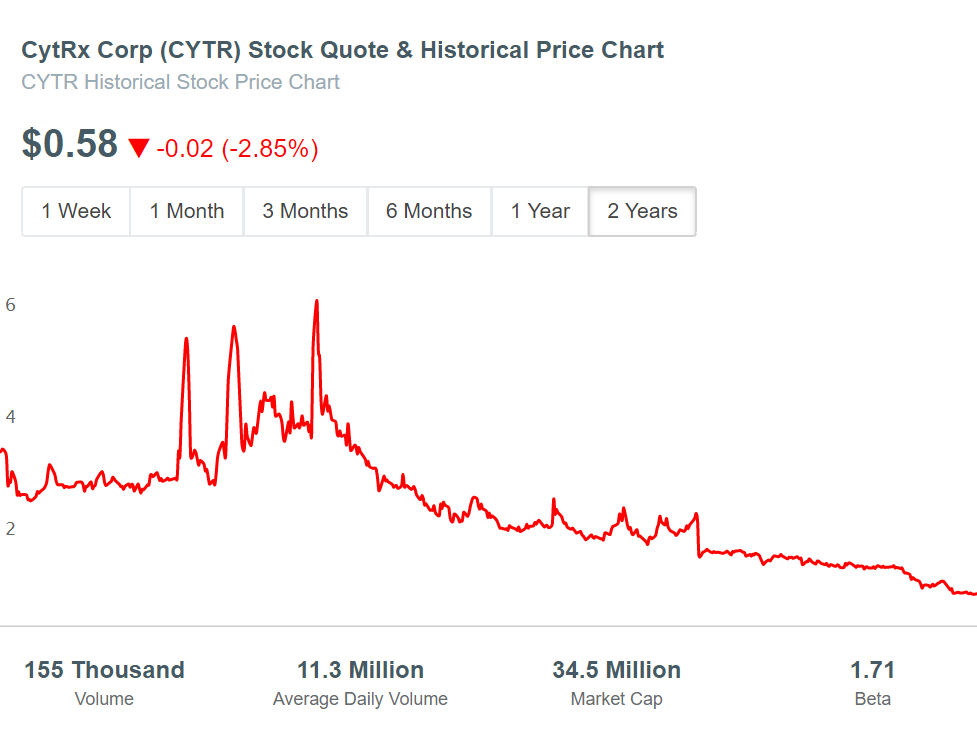
11. CytRx Corp (CYTR)
Average Daily Volume: 11,274,283
Market Capitalization: $34.5 Million
Beta: 1.71
52 Week High: $2.35
52 Week Low: $0.56
Adjusted Close Price: $0.57
CytRx Corp (NASDAQ:CYTR) operates as a biopharmaceutical research and development company specializing in oncology. CytRx is headquartered in California, United States and was was founded in 1985. The Company competes in the Healthcare - Biotechnology Sector, and it’s current CEO is Steven Kriegsman.
Trading penny stocks is a high risk and high reward game.
Given the uncertainty of these 11 stocks, we don’t recommend investing in these companies without proper due diligence.
Penny stocks are typically traded by professionals with years of experience with advanced stock picking software at their disposal. This makes achieving consistent gains by trading penny stocks very difficult.
If you are looking for more actively traded penny stocks, check out our customized stock screener.
Our stock screener gives you the control to find and screen for stocks according to your unique investment strategy.
Select the criteria and benchmarks that fit with your investment strategy to find undervalued stocks to add to your portfolio.