Below is a list of 31 technical indicators you can automatically chart using DiscoverCI’s technical charting tools.
You can automate, modify the parameters, and analyze these technical indicators for over 10,000 stocks.
If you don’t see an indicator that you use frequently in your analysis, let us know! We can build a model and add it to the list below.
1. Adaptive Moving Average (AMA)
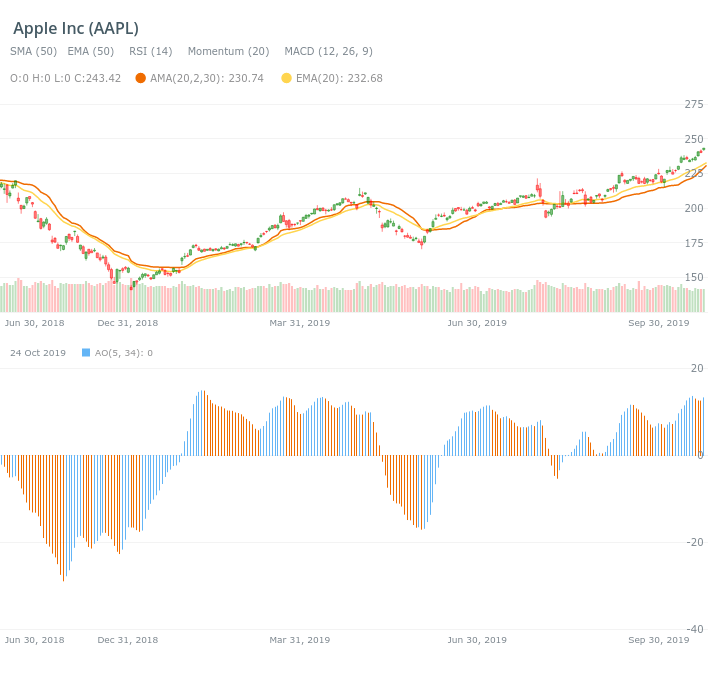
DescriptionAn Adaptive Moving Average (AMA) is an indicator similar to SMA, MMA and EMA. AMA changes its sensitivity due to the price fluctuations. The Adaptive Moving Average becomes more sensitive during periods when price is moving in a certain direction and becomes less sensitive to price movements when it become unstable.
ParametersAMA indicator parameters are: period, fast period and slow period.
2. Aroon
DescriptionDeveloped by Tushar Chande in 1995, Aroon is an indicator system that determines whether a stock is trending or not and how strong the trend is. 'Aroon' means 'Dawn's Early Light' in Sanskrit. Chande chose this name because the indicators are designed to reveal the beginning of a new trend.
The Aroon indicators measure the number of periods since price recorded an x-day high or low. There are two separate indicators: Aroon-Up and Aroon-Down. A 25-day Aroon-Up measures the number of days since a 25-day high. A 25-day Aroon-Down measures the number of days since a 25-day low. In this sense, the Aroon indicators are quite different from typical momentum oscillators, which focus on price relative to time. Aroon is unique because it focuses on time relative to price. Chartists can use the Aroon indicators to spot emerging trends, identify consolidations, define correction periods and anticipate reversals.
ParametersAroon indicator has only one parameter: the period.
3. Average True Range (ATR)
DescriptionDeveloped by J. Welles Wilder, the Average True Range (ATR) is an indicator that measures volatility. As with most of his indicators, Wilder designed ATR with commodities and daily prices in mind. Commodities are frequently more volatile than stocks. They were are often subject to gaps and limit moves, which occur when a commodity opens up or down its maximum allowed move for the session. A volatility formula based only on the high-low range would fail to capture volatility from gap or limit moves. Wilder created Average True Range to capture this 'missing' volatility. It is important to remember that ATR does not provide an indication of price direction, just volatility.
ParametersAverage True Range indicator has only one parameter: the period.
4. Awesome Oscillator (AO)
DescriptionThe Awesome Oscillator (AO) was created by Bill Williams. The Awesome Oscillator is an indicator used to measure market momentum. The Awesome Oscillator indicator is a histogram, it is similar to the MACD indicator – displaying the market momentum of a recent number of periods compared to the momentum of a larger number of previous periods. AO calculates the difference between a 34 Period and 5 Period Simple Moving Average. The Simple Moving Averages that are used are not calculated using closing price but rather each bar's midpoints. AO is generally used to affirm trends or to anticipate possible reversals. If the AO histogram is crossing above the zero line that’s indicative of bullish momentum, reverse is true as well - when AO crosses below that’s indicative of bearish momentum.
ParametersThere are three parameters an Awesome Oscillator indicator has, one of them is necessary - the mapping. The second parameter and third parameters set perod, fourth - Moving Average Type. The last parameter sets the series type.
5. Bollinger Bands (BBands)
DescriptionBollinger Bands are a volatility indicator that is displayed as two lines (bands): one drawn above a simple moving average of the price and one - below. These bands move closer to the moving average when price volatility is low and move farther away from the moving average when price volatility increases.
ParametersBollinger Bands parameters can be adjusted. The default parameters are: 20 periods for the simple moving average and 2 for the standard deviations (the distance between each band and the SMA). Increasing the number of periods - decreases the volatility of the SMA, and decreasing their number - increases the volatility of the SMA. Increasing the number of standard deviations moves the bands farther away from the SMA, and decreasing - moves the bands closer to the SMA.
Bollinger Bands parameters are the period and the deviation.
FunctionBollinger Bands are used to determine how volatile a stock is. Stocks move between levels of high and low volatility, and when the Bollinger bands grip a stock, it is a sign that the stock is consolidating and that a breakout is inevitable. When the Bollinger bands widen, it is a sign that the stock has burst out into a new trend.
6. Bollinger Bands %B (BBands B)
DescriptionBollinger Bands %B is an indicator derived from Bollinger Bands.
Parameters%B quantifies a security's price relative to the upper and lower Bollinger Band. There are six basic relationship levels:
- %B equals 1 when price is at the upper band
- %B equals 0 when price is at the lower band
- %B is above 1 when price is above the upper band
- %B is below 0 when price is below the lower band
- %B is above .50 when price is above the middle band (SMA)
- %B is below .50 when price is below the middle band (SMA)
Bollinger Bands %B parameters are the period and the deviation.
7. Bollinger Bands Width (BBands Width)
DescriptionBollinger Bands Width is an indicator derived from Bollinger Bands.
Non-normalized Bollinger Bands Width measures the distance, or difference, between the upper band and the lower band. Bollinger Bands Width decreases Bollinger Bands narrow and increases as Bollinger Bands widen because Bollinger Bands are based on the standard deviation.
ParametersBollinger Bands Width parameters are the period and the deviation.
8. Exponential moving average (EMA)
DescriptionAn Exponential Moving Average is a trending indicator - a single line that shows the weighted mean of the stock price during a specified period of time. This type of moving average that is similar to a Simple Moving Average, except that more weight is given to the latest data.
ParametersEMA period parameter can be adjusted. The default parameter is 20 periods. Increasing the number of periods will decrease the volatility, and decreasing the number of periods will increase the volatility.
EMA indicator has only one parameter: the period.
FunctionExponential Moving Averages are used by traders to detect the trend of the stock and to identify possible levels of support and resistance. If the Exponential Moving Average is trending higher and the price is above it, the stock is considered to be in an uptrend, in other case - if it is trending lower and the price is below it, the stock is considered to be in a downtrend. Also, when the price is above an uptrending EMA line, the Exponential Moving Average can act as a possible support level. In the same way, when the price below a downtrending EMA line - the Exponential Moving Average can act as a possible resistance level.
9. Stochastic Oscillator (Full)
DescriptionThe Full Stochastic Oscillator is a momentum indicator that consists of two lines - %K and %D, these lines move in a range between 0 and 100. The full stochastic shows the interrelation of the current closing price to the trading range in the past. If the current closing price is toward the top of the past trading range, %K moves higher. If the current closing price is toward the bottom of the past trading range, %K moves lower.
ParametersThe full stochastic parameters can be adjusted. The default parameters are 20 periods for the time frame, 5 periods for the %K, and 3 periods for the %D smoothing. Increasing the number of periods for the time frame decreases the volatility of the full stochastic, decreasing the number of periods for the time frame increases the volatility of the full stochastic. Increasing the number of periods for the %K decreases the volatility of the %K line, and decreasing the number of periods for the time frame increases the volatility of the %K line. Also, increasing the number of periods for the %D smoothing decrease the volatility of the %D line, and decreasing the number of periods for the time frame increases the volatility of the %D line.
FunctionThe Full Stochastic Oscillator is used to determine is there bullish or bearish momentum behind a stock. When %K is above %D, the full stochastic shows bullish momentum, %K below %D - shows bearish momentum. Also, %K above 80 shows the market may be overbought, and %K below 20 - the market may be oversold.
10. Stochastic Oscillator (Fast)
DescriptionThe Fast Stochastic Oscillator is a momentum indicator that consists of two lines - %K and %D, these lines move in the range between 0 and 100. The fast stochastic shows the interrelation of the current closing price to the trading range in the past. When the current closing price is toward the top of the past trading range, %K moves higher. If the current closing price is toward the bottom of the past trading range, %K moves lower.
ParametersThe fast stochastic parameters can be adjusted. The default parameters are 20 periods for the time frame and 3 periods for the %D smoothing. Increasing the number of periods for the time frame decreases the volatility of the indicator, and decreasing the number of periods - decreases the volatility. Increasing the number of periods for the %D smoothing decreases the volatility of the %D line and decreasing the number of periods for the time frame increases the volatility of the %D line.
FunctionThe Fast Stochastic Oscillator is used to determine whether there is bullish or bearish momentum behind a stock. %K above %D in the fast stochastic shows a bullish momentum, and %K below %D - shows a bearish momentum. Also, when %K is above 80, it shows that the market may be overbought, and %K below 20 - shows the market may be oversold.
11. Stochastic Oscillator (Slow)
DescriptionThe Slow Stochastic Oscillator is a momentum indicator that consists of two lines - %K and %D, these lines move in the range between 0 and 100. The slow stochastic shows the interrelation of the current closing price to the trading range in the past. If the current closing price is toward the top of the past trading range, %K moves higher. If the current closing price is toward the bottom of the past trading range, %K moves lower.
ParametersSlow stochastic parameters can be adjusted. The default parameters are 20 periods for the time frame and 5 periods for the %D smoothing. Increasing the number of periods for the time frame decreases the volatility of the slow stochastic, and decreasing the number of periods for the time frame will increase the volatility of the slow stochastic. Also, increasing the number of periods for the %D smoothing decreases the volatility of the %D line, and decreasing the number of periods for the time frame increases the volatility of the %D line.
FunctionThe Slow Stochastic Oscillator is used to determine whether there is bullish or bearish momentum behind a stock. %K above %D in the slow stochastic shows bullish momentum, and %K below %D - shows bearish momentum. Also, when %K is above 80, it shows the market may be overbought, and when %K is below 20 - shows the market may be oversold.
12. KDJ
DescriptionKDJ indicator is a technical indicator used to analyze and predict changes in stock trends and price patterns in a traded asset. KDJ indicator is also known as the random index. It is a very practical technical indicator which is most commonly used in market trend analysis of short-term stock.
KDJ is a derived form of the Stochastic Oscillator Indicator with the only difference of having an extra line called the J line. Values of %K and %D lines show if the security is overbought (over 80) or oversold (below 20). The moments of %K crossing %D are the moments for selling or buying. The J line represents the divergence of the %D value from the %K. The value of J can go beyond [0, 100] for %K and %D lines on the chart.
ParametersKDJ indicator has a lot of optional parameters:
- a period for the %K value
- the moving average type of the indicator for the %K value
- a period for the smoothed %K value
- the moving average type of the indicator for the %D value
- a period for the %D value
- multipliers of the %K and %D values for %J value calculating
- series types of the %K, %D and %J values.
The Slow Stochastic Oscillator is used to determine whether there is bullish or bearish momentum behind a stock. %K above %D in the slow stochastic shows bullish momentum, and %K below %D - shows bearish momentum. Also, when %K is above 80, it shows the market may be overbought, and when %K is below 20 - shows the market may be oversold.
13. KeltnerChannels
DescriptionKeltner Channels are volatility-based envelopes set above and below an exponential moving average (EMA).
This indicator is similar to Bollinger Bands, which uses the standard deviation to set the bands. Instead of using the standard deviation, Keltner Channels use the Average True Range (ATR) to set the channel distance. The channels are typically set two Average True Range values above and below the 20-day EMA. The exponential moving average dictates the direction, and the Average True Range sets the channel width. Keltner Channels are a trend following indicator used to identify reversals with channel breakouts and channel direction. Channels can also be used to identify overbought and oversold levels when the trend is flat.
ParametersThere are six parameters a Keltner Channel indicator has. The "maPeriod" and "atrPeriod" parameters set the Moving Average period and Average True Range period. The "maType" parameter sets the smoothing type, the next parameter is the multiplier, and the three last parameters allow you to set the series type of Moving Average and the range series.
14. Modified Moving Average (MMA)
DescriptionA Modified Moving Average (MMA) (also known as Running Moving Average (RMA), or SMoothed Moving Average (SMMA)) is an indicator that shows the average value of a security's price over a period of time. It works very similar to the Exponential Moving Average, they are equivalent but for different periods (e.g. the MMA value for a 14-day period will be the same as EMA-value for a 27-days period).
MMA is partly calculated like SMA: the first point of the MMA is calculated the same way it is done for SMA. However, other points are calculated differently:the new price is added first and then the last average is subtracted from the resulting sum.
ParametersMMA indicator has only one parameter: the period.
15. Moving Average Convergence/Divergence (MACD)
DescriptionThe Moving Average Convergence/Divergence (MACD) is a momentum indicator that consists of two lines - an indicator line and a signal line. The indicator line displays the difference between two exponential moving averages with different smoothing factors, and the signal line displays an exponential moving average of the difference between mentioned two exponential moving averages.
ParametersMACD parameters can be adjusted. The default parameters are 26 for the slow exponential moving average, 12 for the fast exponential moving average and 20 for the signal line. Decreasing any of the parameters decreases the volatility of the related line, and increasing them - increases the volatility of the related line.
FunctionThe MACD is used to determine is there bullish or bearish momentum behind a stock. When the indicator line is above the signal line, the MACD shows bullish momentum, and the indicator line below the signal line in the MACD shows bearish momentum.
16. On Balance Volume (OBV)
DescriptionOn Balance Volume (OBV) measures buying and selling pressure as a cumulative indicator that adds volume on up days and subtracts volume on down days. OBV was developed by Joe Granville and introduced in his 1963 book, Granville's New Key to Stock Market Profits. It was one of the first indicators to measure positive and negative volume flow. Chartists can look for divergences between OBV and price to predict price movements or use OBV to confirm price trends.
ParametersFor OBV indicator only series type can be adjusted.
17. Momentum
DescriptionThe Momentum indicator is a speed of movement indicator, that is designed to identify the speed (or strength) of a price movement. The momentum indicator compares the most recent closing price to a previous closing price and may be used as a trend-following oscillator (similar to the Moving Average Convergence Divergence (MACD)).
ParametersThere are two parameters: the period and the series type.
FunctionThe Momentum indicator identifies when the price is moving upwards or downwards, and also by how much the price is moving upwards or downwards. When the momentum indicator is above zero, the price has upwards momentum, and when the momentum indicator is below zero the price has downwards momentum.
18. Price Channels
DescriptionPrice Channels are lines set above and below the price of a security. The upper channel is set at the x-period high and the lower channel is set at the x-period low. For a 20-day Price Channel, the upper channel would equal the 20-day high and the lower channel would equal the 20-day low. The dotted centerline is the midpoint between the two channel lines. Price Channels can be used to identify upward thrusts that signal the start of an uptrend or downward plunges that signal the start of a downtrend. Price Channels can also be used to identify overbought or oversold levels within a bigger downtrend or uptrend.
ParametersThere are four parameters a Price Channel indicator has. The first parameter sets the period, and the next three parameters allow you to set the series type of the middle and range series.
19. Parabolic SAR (PSAR)
DescriptionParabolic SAR (SAR - stop and reverse) is a method devised by J. Welles Wilder, Jr, to find trends in market prices or securities. It may be used as a trailing stop loss based on prices tending to stay within a parabolic curve during a strong trend.
ParametersThere are four parameters a PSAR indicator has. Three other ones are the acceleration factor start, acceleration factor increment, acceleration factor maximum, and the series type.
20. Rate of Change (ROC)
DescriptionThe Rate of Change oscillator is a momentum indicator that consists of one line. The ROC measures the percentage change in the price from one trading period to the next. If the percentage change is big, the ROC line moves harshly up or down, depending on price changing direction. In other case - if the percentage change is small, the ROC line moves slowly up or down, depending on the price changing direction.
ParametersThe ROC indicator parameters can be adjusted. The default parameter is 12 periods for the time frame. Increasing the number of periods for the time frame decreases the volatility of the ROC indicator, and decreasing the number of periods for the time frame increases the volatility of the ROC indicator.
FunctionThe ROC oscillator is used to determine is there bullish or bearish momentum behind a stock. The ROC line above the zero line shows bullish momentum, and the ROC line below the zero line shows bearish momentum.
21. Relative Strength Index (RSI)
DescriptionThe Relative Strength Index (RSI) oscillator is a momentum indicator that consists of one line that moves in a range between 0 and 100.
ParametersThe RSI parameters are adjustable. The default parameter is 14 periods for the time frame. Increasing the number of periods for the time frame decreases the volatility of the RSI, and decreasing the number of periods for the time frame decreases it.
FunctionThe RSI oscillator is used to determine is there bullish or bearish momentum behind a stock. The RSI line moving higher shows bullish momentum, and the RSI line moving lower shows bearish momentum. Also, the RSI line above 70 shows the market may be overbought, and the RSI line below 30 - the market may be oversold.
22. Simple Moving Average (SMA)
DescriptionA Simple Moving Average is a trending indicator that is displayed as a single line that shows the mean price during a specified period of time. For example, a 20-day SMA shows the average stock price during the last 20 trading periods (including the current period).
ParametersSMA period parameter can be adjusted. The default parameter is 20 periods. Increasing the number of periods will decrease the volatility, and decreasing the number of periods will increase the volatility.
UsageSimple Moving Averages are used by traders to detect the trend of the stock and to identify possible levels of support and resistance. If the Simple Moving Average is trending higher and the price is above it, the stock is considered to be in an uptrend, in other case - if it is trending lower and the price is below it, the stock is considered to be in a downtrend. Also, when the price is above an uptrending SMA line, the Simple Moving Average can act as a possible support level. In the same way, when the price below a downtrending SMA line - the Simple Moving Average can act as a possible resistance level.
23. Accumulation Distribution Line (ADL)
DescriptionDeveloped by Marc Chaikin, the Accumulation Distribution Line is a volume-based indicator designed to measure the cumulative flow of money into and out of a security. Chaikin originally referred to the indicator as the Cumulative Money Flow Line. As with cumulative indicators, the Accumulation Distribution Line is a running total of each period's Money Flow Volume. First, a multiplier is calculated based on the relationship of the close to the high-low range. Second, the Money Flow Multiplier is multiplied by the period's volume to come up with a Money Flow Volume. A running total of the Money Flow Volume forms the Accumulation Distribution Line. Chartists can use this indicator to affirm a security's underlying trend or anticipate reversals when the indicator diverges from the security price.
ParametersFor ADL indicator only series type can be adjusted.
24. Commodity Channel Index (CCI)
DescriptionDeveloped by Donald Lambert and featured in Commodities magazine in 1980, the Commodity Channel Index (CCI) is a versatile indicator that can be used to identify a new trend or warn of extreme conditions. Lambert originally developed CCI to identify cyclical turns in commodities, but the indicator can successfully applied to indices, ETFs, stocks and other securities. In general, CCI measures the current price level relative to an average price level over a given period of time. CCI is relatively high when prices are far above their average. CCI is relatively low when prices are far below their average. In this manner, CCI can be used to identify overbought and oversold levels.
ParametersThere are only two parameters - the period and the series type.
25. Chaikin Money Flow (CMF)
DescriptionDeveloped by Marc Chaikin, Chaikin Money Flow measures the amount of Money Flow Volume over a specific period. Money Flow Volume forms the basis for the Accumulation Distribution Line. Instead of a cumulative total of Money Flow Volume, Chaikin Money Flow simply sums Money Flow Volume for a specific look-back period, typically 20 or 21 days. The resulting indicator fluctuates above/below the zero line just like an oscillator. Chartists weigh the balance of buying or selling pressure with the absolute level of Chaikin Money Flow. Chartists can also look for crosses above or below the zero line to identify changes on money flow.
ParametersThere are only two parameters - the period and the series type.
26. Money Flow Index (MFI)
DescriptionMoney flow index (MFI) is an oscillator calculated over an N-day period, ranging from 0 to 100, showing money flow on up days as a percentage of the total of up and down days.
ParametersThere are only two parameters - the period and the series type.
27. Directional Movement Index (DMI)
DescriptionDeveloped by Marc Chaikin, the DMI measures the momentum of the Accumulation Distribution Line using the MACD formula. This makes it an indicator of an indicator. The DMI is the difference between the 3-day EMA of the Accumulation Distribution Line and the 10-day EMA of the Accumulation Distribution Line. Like other momentum indicators, this indicator is designed to anticipate directional changes in the Accumulation Distribution Line by measuring the momentum behind the movements. A momentum change is the first step to a trend change. Anticipating trend changes in the Accumulation Distribution Line can help chartists anticipate trend changes in the underlying security. The Chaikin Oscillator generates signals with crosses above/below the zero line or with bullish/bearish divergences.
ParametersDMI indicator needs six parameters: two periods: period and a period for ADX, a smoothing mode for whilders ad three series types (for +DI, -DI and ADX series of the indicator).
28. Chaikin Oscillator (CHO)
DescriptionDeveloped by Marc Chaikin, the Chaikin Oscillator measures the momentum of the Accumulation Distribution Line using the MACD formula. This makes it an indicator of an indicator. The Chaikin Oscillator is the difference between the 3-day EMA of the Accumulation Distribution Line and the 10-day EMA of the Accumulation Distribution Line. Like other momentum indicators, this indicator is designed to anticipate directional changes in the Accumulation Distribution Line by measuring the momentum behind the movements. A momentum change is the first step to a trend change. Anticipating trend changes in the Accumulation Distribution Line can help chartists anticipate trend changes in the underlying security. The Chaikin Oscillator generates signals with crosses above/below the zero line or with bullish/bearish divergences.
ParametersThe Chaikin Oscillator indicator has 4 parameters: fast period, slow period, moving averagae type and the series type.
29. TRIX
DescriptionTRIX is a momentum oscillator that displays the percent rate of change of a triple exponentially smoothed moving average. It was developed in the early 1980's by Jack Hutson, an editor for Technical Analysis of Stocks and Commodities magazine. With its triple smoothing, TRIX is designed to filter insignificant price movements. Chartists can use TRIX to generate signals similar to MACD. A signal line can be applied to look for signal line crossovers. A directional bias can be determined with the absolute level. Bullish and bearish divergences can be used to anticipate reversals.
ParametersThere are six parameters a TRIX Channel indicator has. The next two parameters, "period" and "signalPeriod", set the TRIX and signal periods. The "maType" and "signalMaType" parameters set the soothing types of the indicator and the signal. Finally, the last two allow you to set the seires type of both the indicator and the signal.
30. Williams %R
DescriptionWilliams %R, or just %R, is a momentum indicator showing the current closing price in relation to the high and low of the past N days (for a given N). It was developed by trader and author Larry Williams and is used in the stock and commodities markets.
ParametersThere are only two parameters - the period and the series type.
31. VolumeMA
DescriptionA Volume + Moving Average indicator is used in charts and technical analysis. It refers to the average volume of a security, commodity, or index constructed in a period as short as a few minutes or as long as several years and showing trends for the latest interval.
ParametersThere are four parameters Volume + MA indicator has. The next two parameters, "maPeriod" and "maType", set the period and type of the Moving Average. The last two, "volumeSeriesType" and "maSeriesType", allow you to set the Volume and MA series types.
Next Steps
Now that you have the list of technical indicators available for automated charting, it's time to get started!
Check out these indicators in action using the DiscoverCI Stock Charting Software.